The Dangers of Core Web Vitals
After some delay Google has finally rolled out its Page Experience update; which now makes Core Web Vitals a ranking signal; widening the appeal of website speed optimisation.
For those unfamiliar with testing website speed metrics, it’s very easy to base your assumptions on inaccurate data.
Lab-based testing
Most services for testing site speed are known as lab-based tools. These tools take a snapshot look at your website, measuring results at the time the test is run. Repeat this experiment using another service, or even with the same tool 5 minutes later and the results are likely to fluctuate.
There are a number of reasons for this. One very simple example is that of load; the more users that access the website, the slower the server responds due to the extra work asked of it.
Another example is that lab tests can originate from any location. If you were to test your website using a service based on the other side of the world the results will be different to those returned by a tool based on the same network.
Lab-based tools
There are a number of different lab-based tools available, but if we’re looking more specifically at Core Web Vitals, these are the most popular:
- Lighthouse in Chrome DevTools
- Web.dev
- PageSpeed Insights
- WebPageTest
Overview
To show how varied the results from these tools can be, we’ll experiment with one of our client websites; Bathroom Planet. These scores are using the mobile results in all cases.
| Performance Score | Largest Contentful Paint (LCP) | Cumulative Layout Shift (CLS) | Total Blocking Time (TTI) * | |
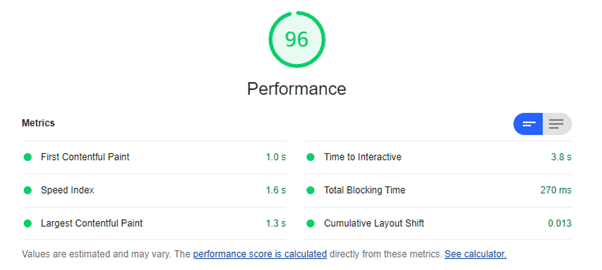
| Lighthouse | 96 | 1.3s | 0.013s | 0.27s |
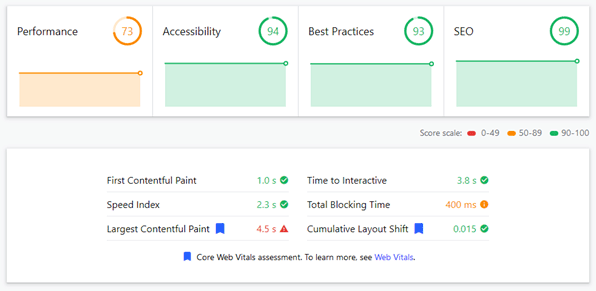
| Web.dev | 73 | 4.5s | 0.015s | 0.40s |
| PageSpeed Insights | 86 | 1.2s | 0.013s | 0.52s |
| WebPageTest | – | 2.2s | 0.020s | 0.91s |
* First Input Delay isn’t measured by lab-based tests so we’re including Total Blocking Time instead.
DevTools Lighthouse
As a tool that’s accessible within the browser, the results returned here are often better than we’d see using external tools, even with the tool throttling the connection.
In our case, the website tested is on the same network so returns results similar to what you may experience when testing local development websites. While these results suggest a performant website, we know that with a privileged connection that these results are likely to be better than what most users might experience.
Web.dev
With an external tool we know we’re likely to see results closer to what real users would experience. Using web.dev we see that our Last Contentful Paint metric takes a hit, returning a score that would normally warrant attention.
But when comparing this to our other results it appears to be an anomalous result, so we’d want to collect more data before making changes to the website.
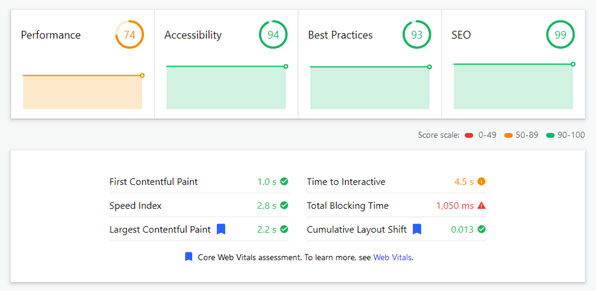
Look at what happens to our results when we run this test again, a little later in the day and without any changes to the website; our LCP metric has improved while our Time to Interactive and Total Blocking Time figures have increased.
If we were only using this tool I’d expect to run it numerous times to gather more data so that we could either spot patterns in the data or calculate averages.
PageSpeed Insights
This is another of Google’s testing tools, which in addition to providing lab results also outputs field data (more on that later). When testing with this tool we see metrics which are a mix of the results we’ve seen by previous tools.
When needing to use an external testing tool by Google, I’d always gravitate to PageSpeed Insights over web.dev.
WebPageTest
This is one of the biggest non-Google tools for testing a variety of metrics. In addition to providing the ability to test solely Core Web Vitals with a couple of configuration options, WebPageTest also offers more advanced testing with a vast variety of controls.
Using WebPageTest is a must for anyone seriously aiming to optimise their website.
Inconsistent results
As you can see, these tools can provide inconsistent results, and so alone don’t tell us in all certainly if our website passes the Core Web Vitals.
We could run more tests in order to gather extra data and identify anomalous results or to see patterns in the results that allow us to be confident in the results and subsequent actions.
Alternatively, we may use our expertise to interpret the few results we do have, understanding why the results are the way they are and if any other red flags exist in the data.
Either way it’s not possible to rely on running any of these tools once to tell us if a problem exists or not.
This doesn’t mean that lab tests should be ignored completely, just that the data must be interpreted. They’re really the only way to test newly developed websites and features as well as providing more granular detail to help identify problems and solutions as they arise.
Field data & CrUX
If you want to answer the question of whether a website is fast, especially in the eyes of Google or your users, then you need to look at real-world data; also known as field data.
While you can measure these metrics yourself, most will rely on the data produced from the Chrome User Experience (CrUX) Report. This is data Google gathers from real users visiting your website using the Chrome browser.
It’s the last 28 days of this data that Google uses to inform whether a page passes specific metrics and in turn this is what impacts rankings.
You can access this data using:
- PageSpeed Insights
- WebPageTest
- Search Console
- Chrome User Experience Report (we use this report by Rick Viscomi)
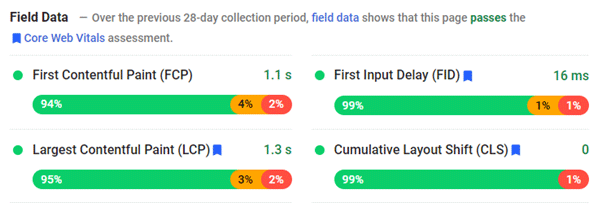
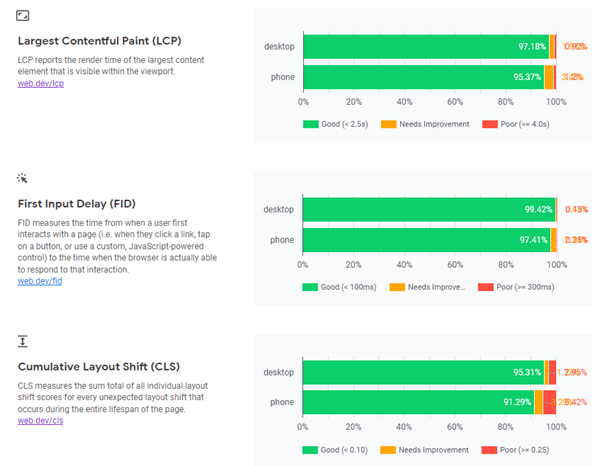
On PageSpeed Insights, as well as average figures, you’ll see that the field data provides percentages to show how many users have a Good, Poor or “Needs Improvement” experience. At over 90% Good these results show that the vast majority of users experience a fast website when visiting Bathroom Planet.
Of the few percent with a less than Good experience we could dig deeper into why these users are having a sub-optimal experience, but as a number of these users may be using old devices or slow connections it’s not guaranteed than any changes would see a large shift in these figures.
With over 90% in the green I’d assume the website is well optimised, unless a specific issue was brought to my attention.
Whether or not you can see field data on any tool depends on the age of your website and the amount of data available from recent visits. For some smaller websites there may be insufficient data for a specific page you’re testing, or even for the entire website/origin.
CrUX Report
Though PageSpeed Insights and WebPageTest will show you field data for a given page, and PageSpeed Insights will also show results for an entire domain (Show Origin Summary) the CrUX report provides far more granular information.
Though it’s possible to dive into this data yourself and create custom reports, the dashboard created by Rick Viscomi is a far quicker option:
Within these reports you can see a breakdown by phone and desktop as well as monthly historical data for Core Web Vitals, including First Input Delay which you don’t see in Lab tests.
Within the Bathroom Planet report you can see that most metrics have remained fairly consistent over the past 10 months, though we’ve seen a steady drop in Time to First Byte since January that should be investigated.
Search Console
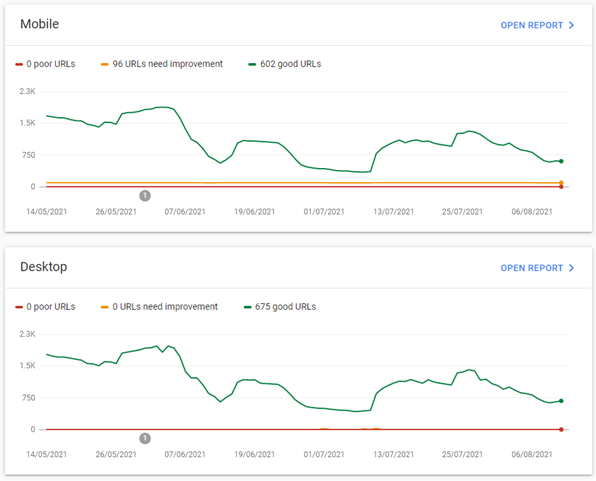
Google’s Search Console takes a slightly different approach in that it shows what pages have specific issues across the Core Web Vitals, differentiating Mobile and Desktop. This is useful in quickly identifying problem pages that you may not think to test manually.
Web vitals library
It’s also possible to measure Core Web Vitals directly in your own website using the web vitals JavaScript library. With this data collected you can either choose to store this information yourself, or export to Google Analytics/Tag Manager.
Field data FTW?
In almost all instances the field data produced by the CrUX report is what you should use to determine if a website is fast or if issues exist both for the user and in the eyes of Google.
Lab tests are best used to gather additional information when looking to fix particular issues, or to test the impact of changes to the website.
Speed Metrics aren’t everything
The metrics which we use to measure the speed of a website are constantly evolving, not only have the metrics we used changed, but the measure for what is good/bad can change too.
Even though these metrics cover a number of scenarios that suggest that adherence will result in a fast website, this isn’t always true. Passing Core Web Vital metrics does not mean a website can’t still be slow, or download a huge amount of data before it’s completely rendered, and so still feel slow to users.
An obsession with speed can also have a negative impact on usability and user experience. There is a limit to how much you can optimise a website before removing features/elements becomes the only option to make it faster. If you start removing things that contribute positively to the user experience the benefits of a faster website will likely be negated by a drop in conversion.
A fast website is always an important goal to work towards, but as with all things there is a balance that should be achieved between this and other concerns.
Share this article
Like what you’ve read, then why not tell others about it... they might enjoy it too
We'd love to hear from you!
If you think Bronco has the skills to take your business forward then what are you waiting for?
Get in Touch Today!


Discussion